Case study N° 03 · Dashboards
PAISD IT Dashboard
A 13-screen operations dashboard that runs 24/7 on the TVs in a school district's IT offices.
Try the demo
Sample data, runs in your browser
- Auto-rotating
- 13screens
- Tickets, workload, equipment, inventory, maintenance, calendar and a team quiz.
- On the office TVs
- 24/7
- Behind Cloudflare Access, with edge-cached reads so a dozen polling TVs stay cheap.
- Of KPI history
- 14days
- A nightly snapshot at 11:55 PM keeps the trend that GoFMX itself does not store.
The problem
The district’s IT team tracked tickets, equipment and inventory in GoFMX, but nobody could see the state of things at a glance. Overdue tickets and parts running low were found too late.
What I built
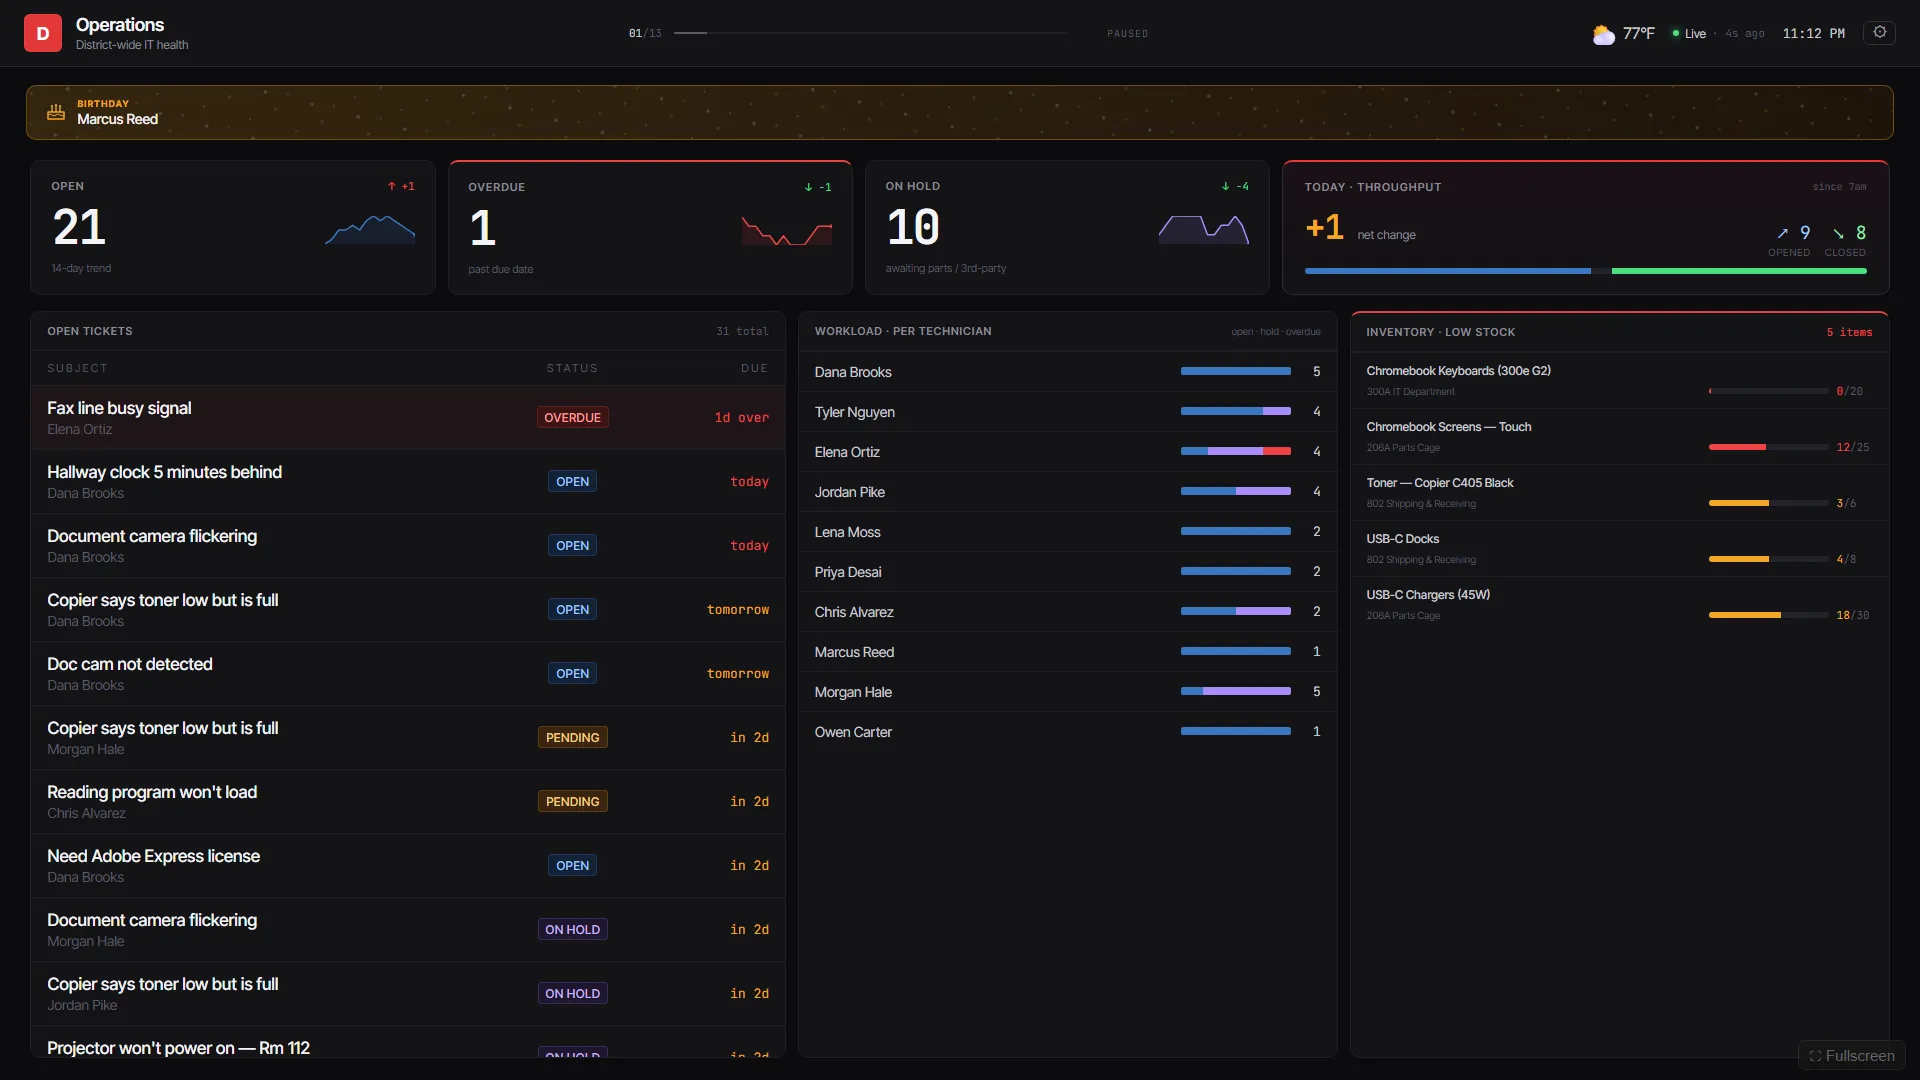
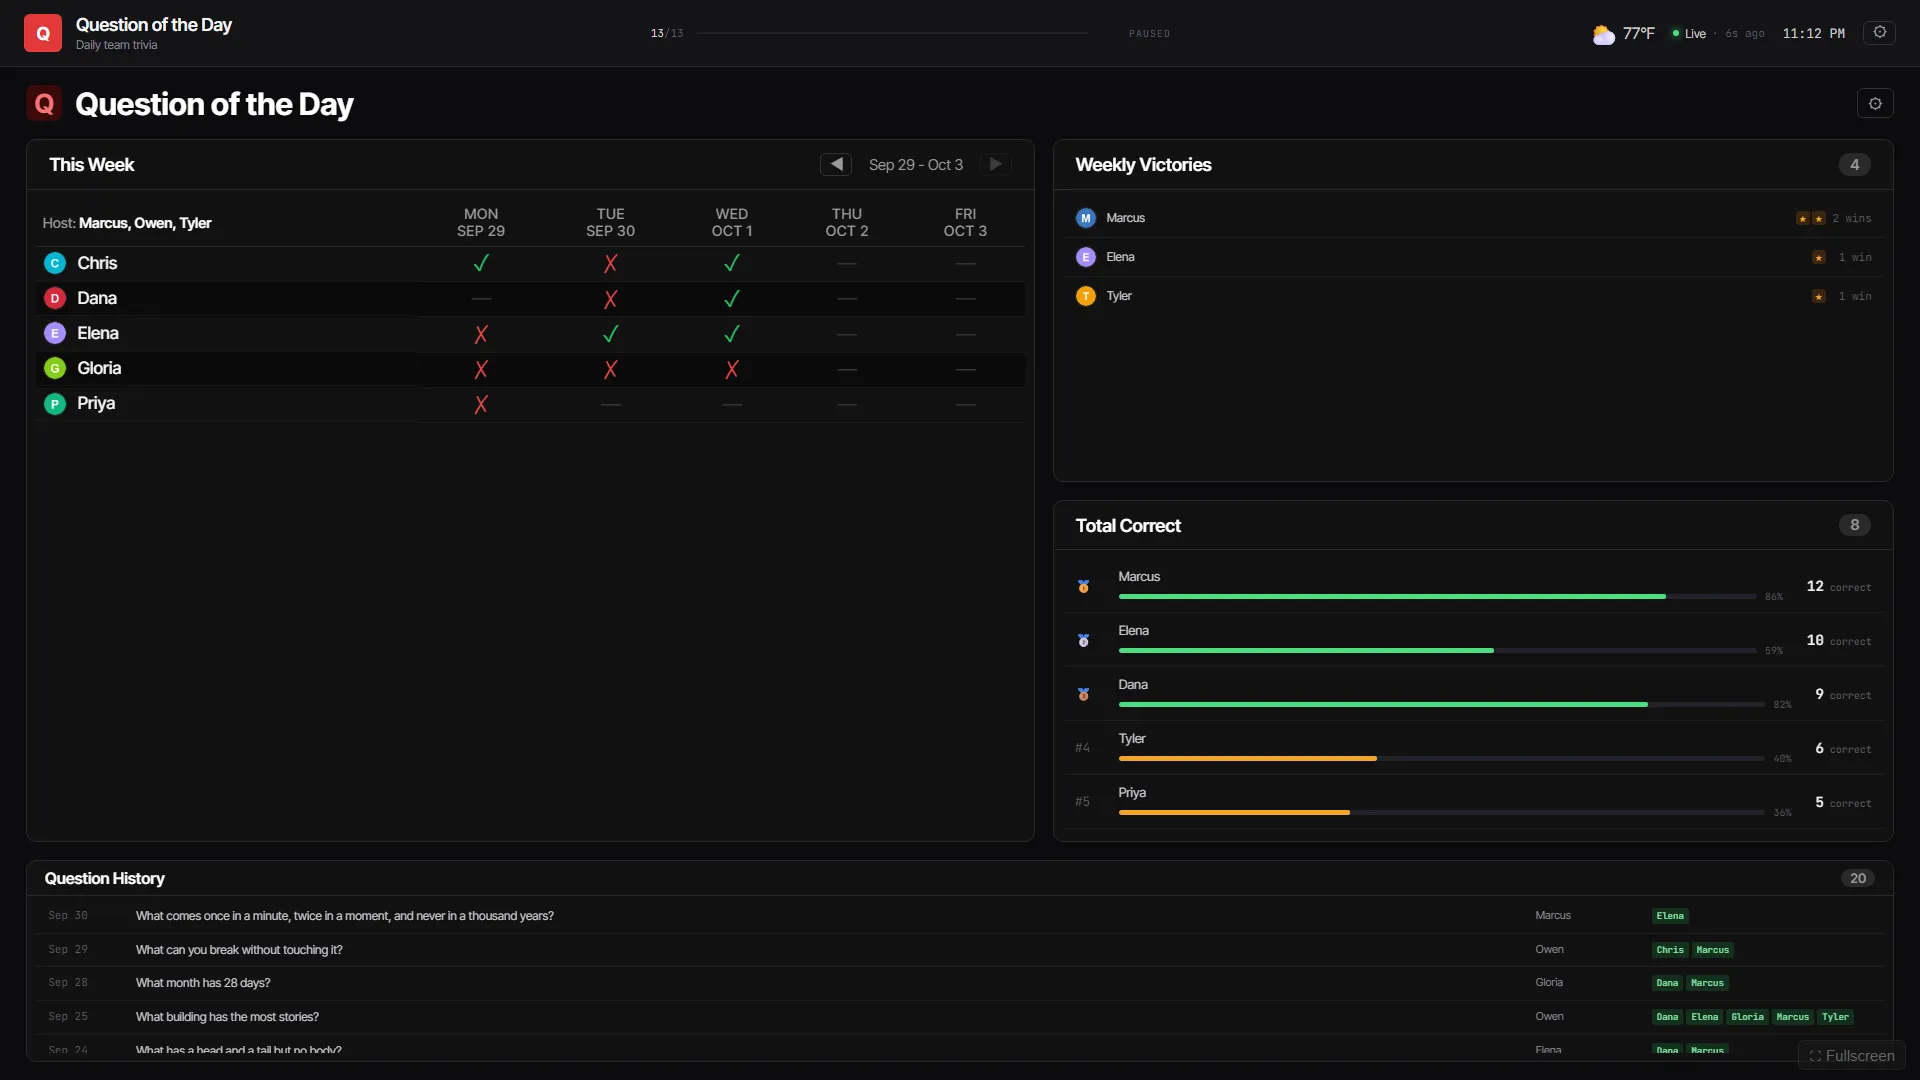
A wall dashboard that auto-rotates through 13 screens: ticket overview, technician workload, equipment, inventory, maintenance, calendar, and a Question of the Day game with a leaderboard that the team actually plays.
- Ticket KPIs with day-over-day deltas, overdue flags and per-technician counts.
- Inventory alerts when stock drops below its minimum.
- Pause, auto mode, per-user settings and a live connection indicator.
The hard part
- A locked-down API proxy. Pages Functions forward requests to the GoFMX REST API, but only for an allowlist of approved paths, so the browser never holds credentials.
- History the source system doesn’t keep. A Cron Worker saves KPI snapshots to D1 at 11:55 PM Central every night. Those snapshots power the 14-day sparklines and burndown charts.
- Edge caching of D1 reads, so a dozen TVs polling all day stays cheap.
Result
In daily production use on the IT department’s TVs, behind Cloudflare Access.
Figures
Methods
- Stack
- Vanilla JS, Cloudflare Pages Functions, Cloudflare D1, Cron Workers, Cloudflare Access, GoFMX REST API.
- Data
- The demo runs in your browser on sample data; nothing is sent anywhere. The real dashboard is internal, behind the district's login. The demo and these screenshots run the same code on invented data.
- Status
- In use since Apr 2026. PAISD IT department, 24/7.